2026 financial year in review

Title
2026 financial year in review
Short description
MLC Asset Management's Senior Economist Bob Cunneen provides a review of investment markets over the 2026 financial year.
Topics
mlc:Topics/news-and-updates
Time to read/watch
8
Effective date
2026-07-07 00:00
Feature Image
/content/dam/mlc/insights/images/Articles/2026/update-from-bob-cunneen-thumbnail.png
Media
false

“Another remarkably strong year for global shares given investor optimism over Artificial Intelligence. This technology enthusiasm outweighed concerns over the Iran War and persistent inflation.”


Download PDF

Another positive year for share returns

Global shares delivered very strong returns in the past financial year. The promise of Artificial Intelligence (AI) has been the key positive driver for rising global share prices. However, the continuing tragic Russian-Ukraine War and the start of the Iran War this year has caused turbulence in global commodity and financial markets.

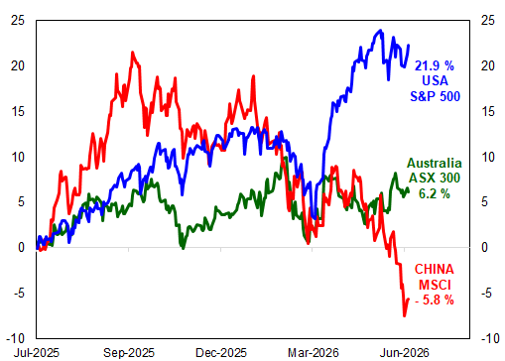
Global shares (hedged) recorded a 25.1% return for the year in local currency terms. A clear outperformer has been Wall Street. US shares as represented by the S&P 500 delivered a 21.9% return for the financial year (Chart 1). By comparison, there was only mild returns for the Australian ASX 300 at 6.2%. Yet this was notably better than the poor performance of the MSCI Chinese shares benchmark which detracted -5.8% over the year. Hence country selection as well as stock selection and currency hedging were critical in the past year. Notably the rising Australian dollar over the past year had moderated global shares (unhedged) to a 17% annual return.

Chart 1: Share returns for financial year 2025-2026

Source: LSEG DataStream.

American share markets climbed to historic highs. Yet this was far from an easy ascent. The surprise attack by the US and Israel on Iran in February 2026 saw Wall Street tumble. Concerns over inflation risks from rising energy and fertiliser prices dented investor confidence. However, April’s precarious ceasefire agreement between Iran and the US has seen share markets regain their composure.

The key factor supporting Wall Street gains is optimism for AI prospects. Nvidia’s role as key supplier of computer chips for AI has seen its share price rise 27% in the past year and retain the title of the world’s most valuable company. The second most valuable company in Alphabet/Google (+103%) and third ranked Apple (41%) also recorded extraordinary share price gains in the past year. Yet this is not a market bubble full of only hot air. According to FactSet, corporate profits are expected to rise +20% in the year to June. Hence US profit growth has kept pace with strong share price gains.

Australia’s share market heavyweights provided a mixed performance in the ring. BHP reclaimed the title of Australia’s most valuable company with a 62% share price gain for the financial year. The Commonwealth Bank lost the title fight by virtue of the investors’ decision to discount its share price by 11%. There were also major falls for CSL (-52% price fall) and Cochlear (-59%) over the past year. Australia’s modest 6.2% share market return was also matched by the mild rise of circa 6% in corporate profits.

Asian shares delivered a wide array of performances. China clearly struggled with a -5.8% return in local currency as large company share prices such as Alibaba (-15%) and BYD (-28%) went backwards. However, the AI optimism supported many other Asian share markets to outweigh China’s dismal performance. Japan’s share market made a very strong +45% annual return. There were astonishing returns in Korea (260%) and Taiwan (124%) as investors are optimistic that AI should lead to robust demand for Asian computer chips. Indeed, this Korean and Taiwanese share price surge were the key contributors to the extraordinary 35.7% return for emerging market shares in the past year. Notably emerging markets outperformed even Wall Street.

Table 1: Asset class returns in Australian dollars – periods to 30 June 2026

Asset class Returns
1 year 3 yrs (pa) 5 yrs (pa) 10 yrs (pa)

Cash

3.9%

4.2%

3.1%

2.2%

Australian bonds

1.5%

4.0%

0.4%

1.8%

Global bonds (hedged)

2.9%

3.7%

0.0%

1.4%

Global high yield bonds (hedged)

5.8%

7.4%

2.8%

4.8%

Global listed infrastructure (hedged)

16.6%

11.8%

7.4%

7.2%

Global property securities (hedged)

14.3%

9.0%

1.8%

3.2%

Australian shares

6.2%

10.6%

7.6%

9.4%

Global shares (unhedged)

17.0%

18.1%

12.8%

13.6%

Global shares (hedged)

25.1%

19.2%

10.9%

12.5%

Emerging markets (unhedged)

35.7%

21.4%

8.9%

10.9%

Past performance is not a reliable indicator of future performance.
Sources: FactSet, MLC Asset Management Services Limited. Benchmark data: Bloomberg AusBond Bank Bill Index (cash), Bloomberg AusBond Composite 0+ Yr Index (Aust bonds), Bloomberg Global Aggregate Bond Index Hedged to $A (global bonds), Barclays US High Yield Ba/B Cash Pay x Financials ($A Hedged) (global high yield bonds) FTSE Global Core Infrastructure 50/50 Index Hedged to $A, FTSE EPRA/NAREIT Developed Index (net) hedged to $A (global property securities), S&P/ASX300 Total Return Index (Aust shares), MSCI All Country World Indices hedged to $A and unhedged (net) (global shares), and MSCI Emerging Markets Index (net) unhedged to $A (emerging markets).

Australian bonds provided a subdued 1.5% annual return. Higher inflation and the Reserve Bank of Australia (RBA) raising the cash rate three times this calendar year by 0.75% has cautioned bond investors.

Global bonds (hedged) delivered a modest 2.9% annual return. Bond markets have experienced shifting tides on global economic activity, inflation and political risks. The Iran War particularly has generated significant inflation risks. Global high yield bonds (hedged) made a stronger 5.8% annual return as investors considered that the elevated yields available are attractive for income despite very narrow credit spreads.


The ‘cost of living’ has become even more challenging

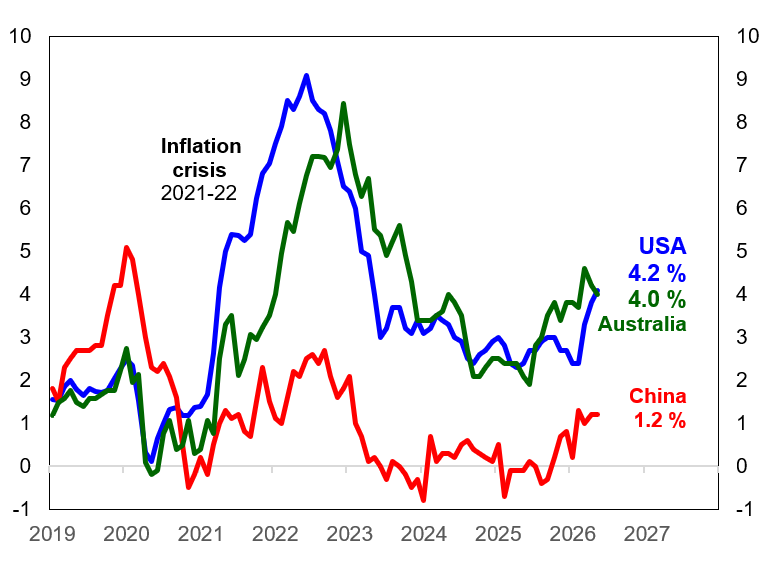
Global inflation increased sharply in the past year (Chart 2). At the start of 2026, inflation was already above what central banks and consumers were comfortable with. Persistent price pressures in key essentials such as electricity, health and housing were squeezing household budgets. The start of the Iran War in February 2026 has only intensified these price pressures. Given that there was effectively a shutdown of shipping transport through the Strait of Hormuz, there was a huge price surge for key commodities such as crude oil, natural gas and fertiliser. Accordingly, both Australian and US consumer inflation surged above 4% in the year to May. Even China saw significantly higher inflation compared to the deflation experience of falling prices over previous years.

Chart 2: Global consumer inflation

Sources: Australian Bureau of Statistics, National Bureau of Statistics of China and US Bureau of Labor Statistics.

Australia’s 4% annual inflation in the year to May 2026 represents a mix of higher goods and services prices. According to the Australian Bureau of Statistics (ABS), beef prices have risen 13.3%, milk by 9.2% and coffee and tea by 7.3% in the year to May. Sharp price rises have also been experienced in the services sector with electricity up by 21.1%, insurance by 5.5% and education by 4.8%.


Positive and negative surprises for the global economy in the past year

Global economic activity has been ‘multi-speed’ in the past year. The US economy has been the key source of strength. Notably the US economy recorded annual gross domestic product (GDP) growth of 2.7% in the year to March 2026 compared to potential growth estimates of circa 2%. America’s technology companies have dramatically increased their capital spending on AI research and building data centres. Solid jobs growth has thus allowed the US unemployment rate to remain stable at around 4.2% and supported wages growth. Hence the US is still punching above its heavyweight status in the global economy.

European economic growth has slowed to only 0.7% for the past year to March. Germany has struggled with annual growth barely registering a pulse at 0.3% given weaker global demand for their luxury cars and intense competition with China. Britain has also struggled with annual growth at a mediocre 0.9%. The malaise in business investment after the 2016 “Brexit” departure from Europe continues to constrain Britain’s prospects.

China’s economic growth at 5% in the past year remains constrained by a cautious consumer and weak property market. Falling property construction and apartment prices have undermined confidence in China’s prospects.

Amongst Australia’s other major trading partners, economic growth has also been more encouraging. India’s economic growth at 7.8% is the strongest amongst major nations and validates India’s long-term potential. Korea has also impressed with strong economic activity with real GDP surging by 3.8% in the past year on the back of AI spending.

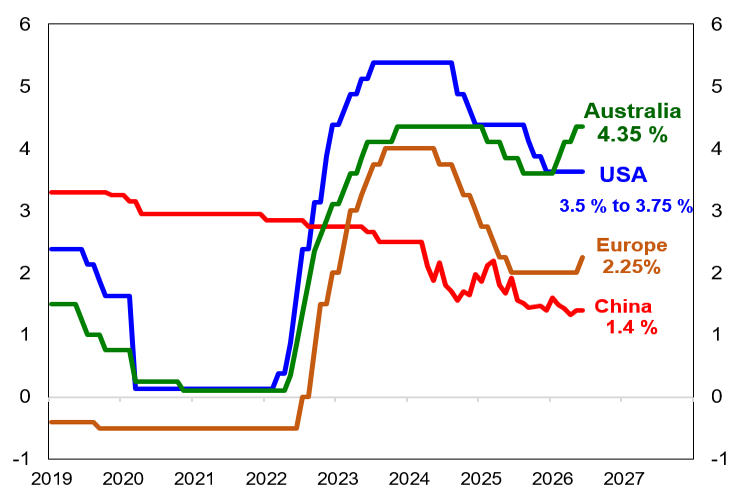
Central Banks have responded to higher inflation with a mixture of calm and concern with their settings of interest rates (Chart 3). The US Federal Reserve has held interest rates steady even with inflation climbing to its highest annual rate in the past three years. China’s central bank has also taken a watching brief on inflation and interest rates in the past year. However, the more alarmed and assertive central banks have included the RBA with 0.75% in interest rate rises in 2026. The European Central Bank and Bank of Japan also responded to inflation pressures by raising interest rates by 0.25% in June 2026.

Chart 3: Global cash interest rates set by central banks


Source: LSEG DataStream.

Australia’s economic performance

Australia’s economy is slowing down judging by the modest economic growth of only 0.3% for the March quarter and 2.5% for the past year. The economy is becoming more dependent on AI investment in building data centres and government spending to keep the lights on. The recovery in consumer spending after the RBA’s interest rate cuts last year is now fading. The three interest rate rises in 2026 and high inflation are placing enormous pressure on consumers’ budgets. While the RBA held interest rates steady in June 2026, the central bank did warn that it is prepared to raise the “cash rate target further if required”.

Notably business and consumer confidence have been registering weak results in recent surveys. The Federal Government’s announcement of major changes to capital gains tax and negative gearing in May has also cast a shadow over prospects for the residential property market. Australian house prices have started to fall led by sharp declines in Sydney and Melbourne. While the Federal Government did extend the fuel excise tax cut until the end of July, the price benefit has been reduced from thirty-two cents to sixteen cents per litre. Hence for many Australian consumers, the “cost of living” squeeze is continuing.

Fortunately, Australia’s labour market has been stable with mild jobs growth and a steady unemployment rate around 4.3%. Wages growth at 3.3% has also been solid in the past year although this has been below the current 4% inflation rate. There is a good chance that the Australian economy can still muddle through this tough patch of slower economic growth and high inflation without further interest rate rises. However, our resilience is likely to be further tested by the precarious climate of global politics.


Global prospects

While financial markets are now hopeful that the ceasefire between Iran and the US will eventually end the war, the military and political situation remains volatile. Leaders in the US, Israel and Iran still need to compromise to ensure that the current ‘Memorandum of Understanding’ becomes a formal peace agreement. Regrettably, there is still a chasm in trust between the warring parties. Until a formal agreement is signed and the drones and missiles stop flying, financial markets and commodity prices remain vulnerable.

If the Iran War intensifies again, this would be a severe challenge for the global economy. Both inflation and unemployment could dramatically rise. For central banks around the world this creates a major policy dilemma – should central banks raise interest rates to restrain inflation pressures or lower interest rates to assist economic activity and mitigate rising unemployment.

Regrettably, the RBA has been a pioneer in raising interest rates three times this year. The European and Japanese central banks also raised interest rates in June. If other major central banks such as the US Federal Reserve follow suit with interest rate rises, this could challenge the recent strong performance of global share prices.

Australian consumers are still being challenged by persistent inflation. Price pressures in food, health and housing are squeezing budgets. This continuing “cost of living” squeeze is likely to weigh heavily on consumer spending over coming months. Lower house prices will also caution some consumers on their spending.

Given these complex and significant risks, investors should maintain a disciplined and diversified strategy.


You might also be interested in

  • This communication is provided by MLC Investments Limited (ABN 30 002 641 661, AFSL 230705) (MLC), part of the Insignia Financial Group of companies (comprising Insignia Financial Ltd, ABN 49 100 103 722 and its related bodies corporate) (‘Insignia Financial Group’). An investment with MLC does not represent a deposit or liability of, and is not guaranteed by, the Insignia Financial Group.

    This information may constitute general advice. It has been prepared without taking account of an investor's objectives, financial situation or needs and because of that an investor should, before acting on the advice, consider the appropriateness of the advice having regard to their personal objectives, financial situation, and needs.
    Past performance is not a reliable indicator of future performance. Share market returns are all in local currency.

    Any opinions expressed in this communication constitute our judgement at the time of issue and are subject to change. We believe that the information contained in this communication is correct and that any estimates, opinions, conclusions, or recommendations are held or made as at the time of compilation. However, no warranty is made as to their accuracy or reliability (which may change without notice), or other information contained in this communication.

    This information is directed to and prepared for Australian residents only.

    MLC may use the services of any member of the Insignia Financial Group where it makes good business sense to do so and will benefit customers. Amounts paid for these services are always negotiated on an arm's length basis. MLC relies on third parties to provide certain information and is not responsible for its accuracy, nor is MLC liable for any loss arising from a person relying on information provided by third parties.

    Bloomberg Finance L.P. and its affiliates (collectively, “Bloomberg”) do not approve or endorse any information included in this material and disclaim all liability for any loss or damage of any kind arising out of the use of all or any part of this material.

    The funds referred to herein is not sponsored, endorsed, or promoted by MSCI, and MSCI bears no liability with respect to any such funds.